
Unisound Engineering Practice: Stress-Testing CubeSandbox Density Limits for RL Rollout
By|Unisound Atlas Intelligent Computing Team
Editor's note: Agent RL rollout places different demands on sandboxes than ordinary Agent services — every trajectory needs a clean, isolated execution environment, lifecycles are minute-scale, volume is massively parallel, and the sandbox may run arbitrary model-generated code. When nominal parameters land in real engineering practice, they are often shaped by workload characteristics, scheduling parameters, resource overselling, runtime peaks, and more.
In their practice of using Cube to support SWE Agent rollout and RL environment training, the Unisound team — on a 128-core 251 GiB machine with 1-core 4096 MiB sandbox specs — derived three sets of numbers: a scheduling ceiling of 117, a no-oversell safety boundary of 58, and a measured steady state of 80-100. This article records the full process from spec configuration and scheduling parameter derivation to measured bottlenecks, along with the problems encountered in production and their solutions.
1. RL Rollout Workload Characteristics and Selection Considerations
What we support with Cube Sandbox is Agent trajectory rollout, split into two types of workloads:
One is SWE Agent data synthesis — having agents batch-solve problems in real code repositories to produce training data; the other is Agent RL environment training, where the reinforcement learning stage requires massive parallel episodes interacting with environments.
This kind of workload has several distinct characteristics that largely determine the technology selection: every trajectory needs a clean, isolated, reproducible execution environment; lifecycles are short, typically minute-scale; volume is enormous — massively parallel. More critically, the sandbox runs arbitrary model-generated code whose behavior is unpredictable — infinite loops, memory leaks, fork bombs, anomalous network calls can all occur — making "secure isolation" a hard requirement for us.
For this kind of workload, throughput matters more than steady-state residency. Trajectory lifecycles are short, so sandboxes are created, executed, and destroyed far more frequently than long-running services — a single node needs to handle tens to over a hundred creation requests per second. Correspondingly, the Cubelet workflow concurrency is configured at 100 each for creation and destruction; combined with Cube's millisecond-level startup, this throughput level is supportable.
Our core judgment during selection was the difference in isolation boundaries. Cube Sandbox's isolation boundary sits at the hardware virtualization layer — each sandbox is an independent KVM MicroVM with its own kernel. This is its most essential difference from the other options we evaluated. Docker's isolation boundary sits at namespaces and Cgroups, sharing the host kernel. For scenarios executing untrusted code, this difference determines whether you can go to production: namespace and Cgroup isolation carries escape risks when an Agent executes arbitrary code, while MicroVM's hardware-level boundary prevents the Agent from affecting the host environment.
For each of our core requirements, Cube has a corresponding capability design. Secure isolation: MicroVM's hardware-level boundary satisfies untrusted code execution. Fast startup: large-scale rollout needs environments created in seconds or even milliseconds — Cube pre-bakes templates into immutable rootfs images and pre-stores memory snapshots locally on each node, so starting a sandbox goes through local reflink cloning rather than cold boot; the officially stated cold start is at the 60 ms level. Environment reproducibility: a template is an immutable ext4 binary artifact, with the same copy distributed to all nodes, avoiding behavioral drift caused by image-layer caching or host differences. Resource control: CPU, memory, and network all have constraint mechanisms, with Cgroup and VM boundaries taking effect in two layers and the scheduler doing unified accounting. High concurrency: Cube's single-node software design ceiling is 3,000 live sandboxes. Cube also natively supports full memory-plus-disk snapshots — MicroVM snapshots can fork from any intermediate state, which directly affects sample efficiency in RL training. That said, we haven't yet put the snapshot layer of capability to deep use.
The business side integrates entirely through the E2B SDK. Cube's sandbox API is compatible with the E2B protocol, so the training-side scheduling code needed no special adaptation — a bonus point during our selection.
However, this compatibility brings one behavioral detail worth noting: the e2b SDK's default command execution is "bash -lc command" — it first launches a brand-new Bash login shell, then executes the specified command inside it. For single executions this default is fine, but if a task itself runs in two phases (say an evaluation preparation pass followed by the evaluation proper), the problem surfaces in the second phase: every command execution launches a fresh login shell, so environment variables, PATH, and other state set in phase one don't carry over to phase two, leaving the two phases with inconsistent environments.
The root cause here is not Cube itself but the E2B SDK protocol's default execution mode — once you confirm commands run through a login shell, the symptom is fully explained. Our workaround is to explicitly re-set the environment variables that need to persist between the two phases, rather than relying on shell state carrying over automatically.
2. Separated Control Plane and Compute Plane Architecture
Our deployment form is 1 control node plus N compute nodes, with the control node itself also participating in computation.
The control node carries Cube's complete control plane: cube-api listens on port 3000 as the SDK entry point; CubeMaster listens on 8089, handling scheduling, the template center, and lifecycle management; cube-lifecycle-manager drives AutoPause; cube-proxy and coredns handle sandbox port exposure; the webui runs on 12088; plus two dependency components, MySQL and Redis. The control node itself also runs network-agent and cubelet, so it's not just the control plane — the machine hosts sandboxes too. Compute nodes, by contrast, are light: they run only network-agent and cubelet, registering to the control plane via ONE_CLICK_CONTROL_PLANE_CUBEMASTER_ADDR=<control node IP>:8089. Once registered, CubeMaster issues sandbox creation and destruction commands to them over gRPC on port 9999.
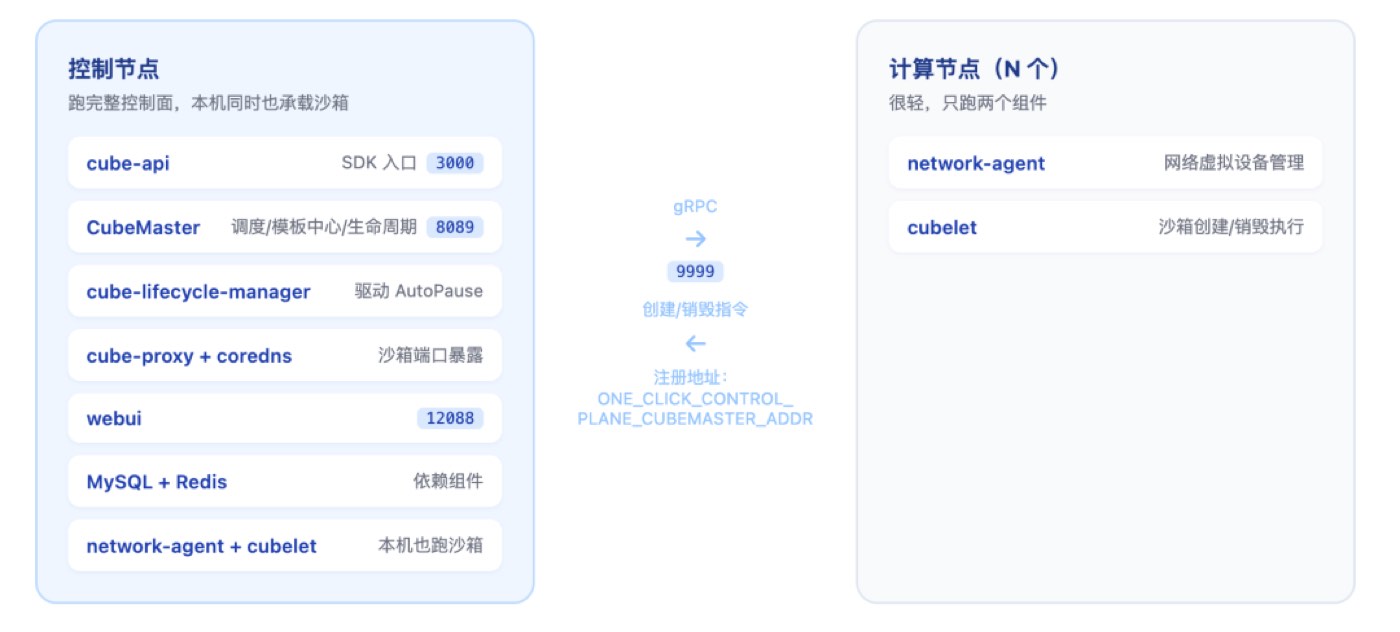
Figure 1: Control plane / compute plane node responsibility split
The template distribution design is key to performance: templates are not placed in shared storage — CubeMaster actively distributes a replica to each compute node. CubeMaster first bakes the OCI image into an ext4 rootfs, then actively pushes it to every compute node; upon receiving it, each node runs a VM locally once more and retains a memory snapshot. Because this replica is already local, starting a sandbox can go through purely local FICLONE cloning with zero network IO — the precondition for millisecond-level startup. The corresponding cost is that every compute node needs a large enough local disk to store these replicas.
Storage configuration must also cooperate with this design: /data/cubelet must use XFS with reflink enabled, because the cubecow storage engine depends on FICLONE and will refuse to start on non-XFS; template images and memory snapshots go on a separate disk, which has no filesystem restrictions.
3. From Scheduling Parameters to Measured Steady-State Density
We currently run Cube v0.6.0 on two dual-node clusters (one control + one compute each), with 128 cores and 251 GiB per machine. Sandbox specs follow the actual needs of the SWE agent: 1 core, 4096 MiB memory, 10 GiB writable layer.
From the sandbox specs and CubeMaster's scheduling parameters, we derived two key numbers: a single-node concurrency ceiling of about 117, and about 234 for two nodes — with the bottleneck on the memory side. Here's how the ceiling is computed: scheduling parameters are set to 10 GiB memory reserved, 2× memory oversell ratio, and 3× CPU oversell ratio with utilization capped at 80%; a single sandbox at 1 core / 4096 MiB spec actually occupies about 4202 MiB of memory. Dividing the two numbers, the memory dimension supports 117 sandboxes, while the CPU dimension theoretically supports up to 306 — taking the smaller of the two, memory is the binding constraint.
To understand the number 117, you first need to understand what "oversell" means here. A 2× memory oversell ratio means the scheduler accepts orders totaling 2× the physical memory: this machine has only 241 GiB of physical memory, but the scheduler hands out quota as if it had about 480 GiB. With no overselling at all, the number of sandboxes a single node can run should be physical memory divided directly by per-sandbox occupancy — 241 GiB ÷ 4.2 GiB ≈ 58. This 58 is the safety boundary where we rely on no assumptions and can guarantee no OOM; 117 is the paper ceiling the scheduler allows us to risk accepting. The gap between 58 and 117 is essentially trading oversell for density — the machine cannot actually hold the memory demand of 117 sandboxes at once.
Whether the paper ceiling of 117 can actually be realized depends on one key assumption: sandboxes won't all max out their 4 GiB of memory simultaneously. This assumption holds most of the time, because Cube's MicroVM uses lazy paging — when a sandbox is idle or waiting for an LLM response, its actual memory usage (RSS) is far below the nominal 4 GiB. But once sandboxes enter compile, dependency-install, or test-run phases typical of SWE scenarios, memory usage quickly climbs toward the 4 GiB limit and the assumption breaks. So our measured result: in steady state, a single node reliably sustains 80-100 concurrent sandboxes, and two nodes about 160-200 — lower than the paper 117/234. The reason is straightforward: whenever a batch of sandboxes hits the compile-phase memory peak at the same time, the host's physical memory is exhausted before the scheduler's paper numbers are.
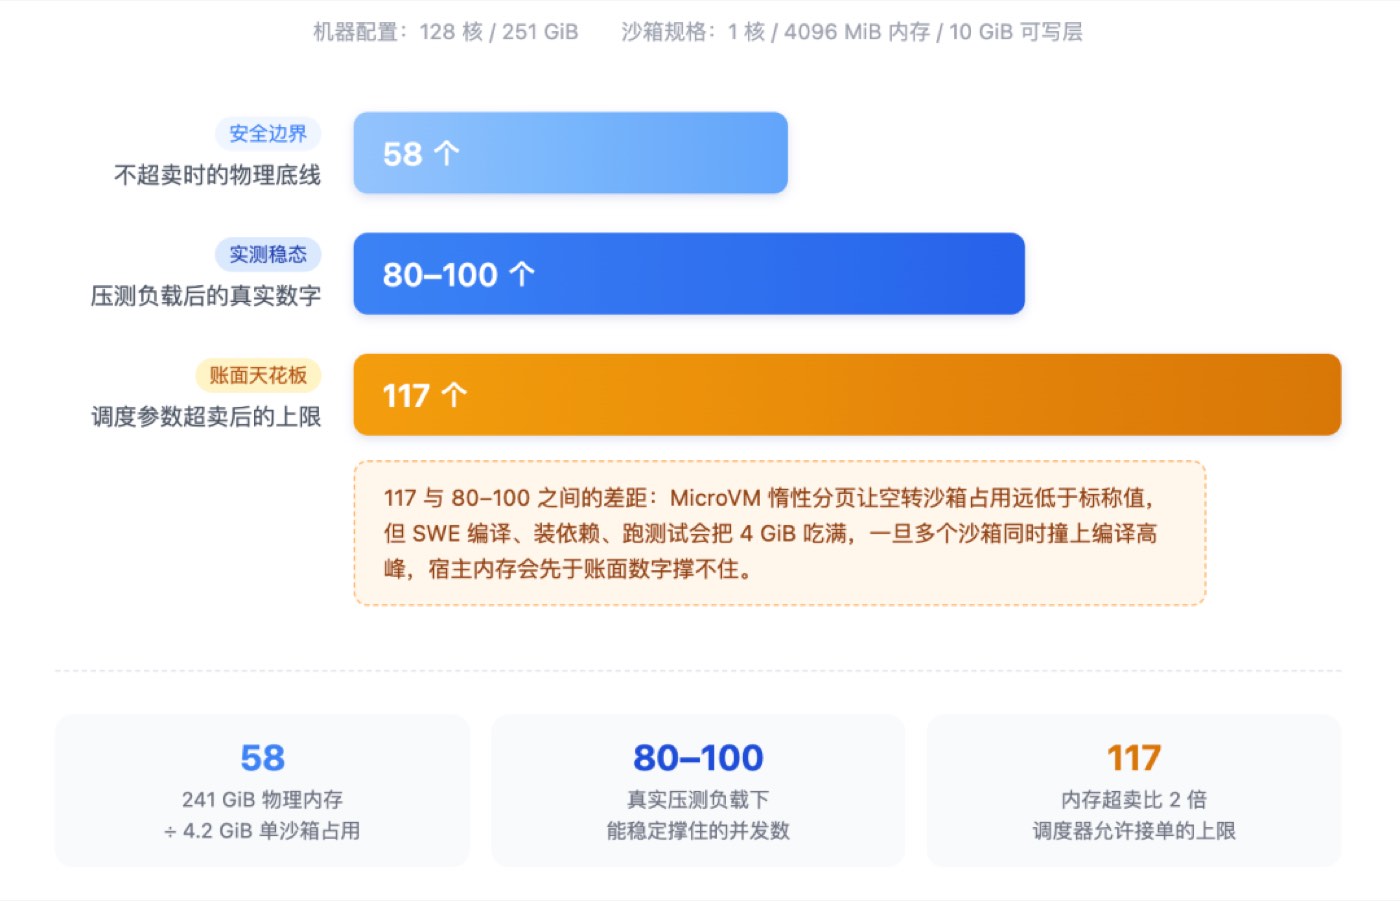
Figure 2: Density derivation ladder
Now look at the CPU side: 117 sandboxes at 1 core each sum to 117 cores, against only 128 physical cores on this machine — 91% utilization. In other words, when the memory side hits the 117 ceiling, the CPU side is nearly saturated at the same time; both resource dimensions top out almost simultaneously. This shows the current sandbox spec (1 core with 4096 MiB) matches the machine's physical configuration (128 cores with 251 GiB) — neither side is obviously overprovisioned while the other jams early.
4. Bottlenecks Observed During Stress Testing
We hit three categories of bottlenecks during stress testing. They behave differently and must be identified separately — otherwise they're easily lumped together as "not enough resources" and misdiagnosed.
The first category is memory oversell actually being cashed in — the moment when the "space between 58 and 117 bought with oversell" mentioned earlier finally collapses. Its symptom: the host's available memory keeps declining until exhausted, then OOM triggers and the OS directly kills processes to free memory. This typically happens when concurrency approaches 117 and a batch of sandboxes happens to hit compile-phase peaks simultaneously — the scenario where the assumption that "sandboxes won't max out 4 GiB at the same time" breaks. One distinction must be made clear: when CPU oversell tops out, sandboxes just slow down and no process is killed; when memory oversell tops out, the OS kills processes outright. These are signals of entirely different natures and must not be conflated.
The second category is disk watermarks causing the scheduler to exclude the node. CubeMaster continuously monitors the usage of several critical disks on each node; as soon as any one of them exceeds 80%, the node is marked as no longer accepting new sandbox creation requests, and new sandbox creation fails with error code 130597 (no more resource). What makes this easy to misjudge: the node still shows HEALTHY on the monitoring dashboard while actually already rejecting new sandboxes.
So when you see 130597, the first reaction should be to check disk watermarks, not node health. We hit this early on: the cube-snapshot component on a single node wrote the system disk to 83%, triggering exactly this error code. One capacity number needs clarifying here: each sandbox's writable layer caps at 10 GiB, so 117 sandboxes would theoretically occupy 1.14 TiB in the worst case — but that's only a worst-case estimate; the actual copy-on-write (CoW) space used is usually far smaller. The rule that must be followed: writable layers must live on the data disk, not the root disk where the system resides — otherwise you'll easily reproduce the pit we stepped into.
The third category is concurrency contention during creation bursts — this one is completely unrelated to whether the live sandbox count is maxed out; it can trigger even when the current live count is far below 80-100. The specific scenario: when a large number of creation requests are issued simultaneously in a short window, requests stall at the step where network-agent allocates tap devices, manifesting as unix socket communication timeouts, with the SDK receiving 500 errors. Our measured result: a single node completes about 20 simultaneous creation requests normally; beyond that, it reliably stalls at this step. Two easily confused concepts need distinguishing here: "stably hosting 80-100 sandboxes" and "concurrently creating 80-100 sandboxes at the same moment" are not the same thing — residency is a total maintained over a period of time, while creation is an instantaneous concurrent action, and creation requests themselves must be queued. The two pressure models are completely different.
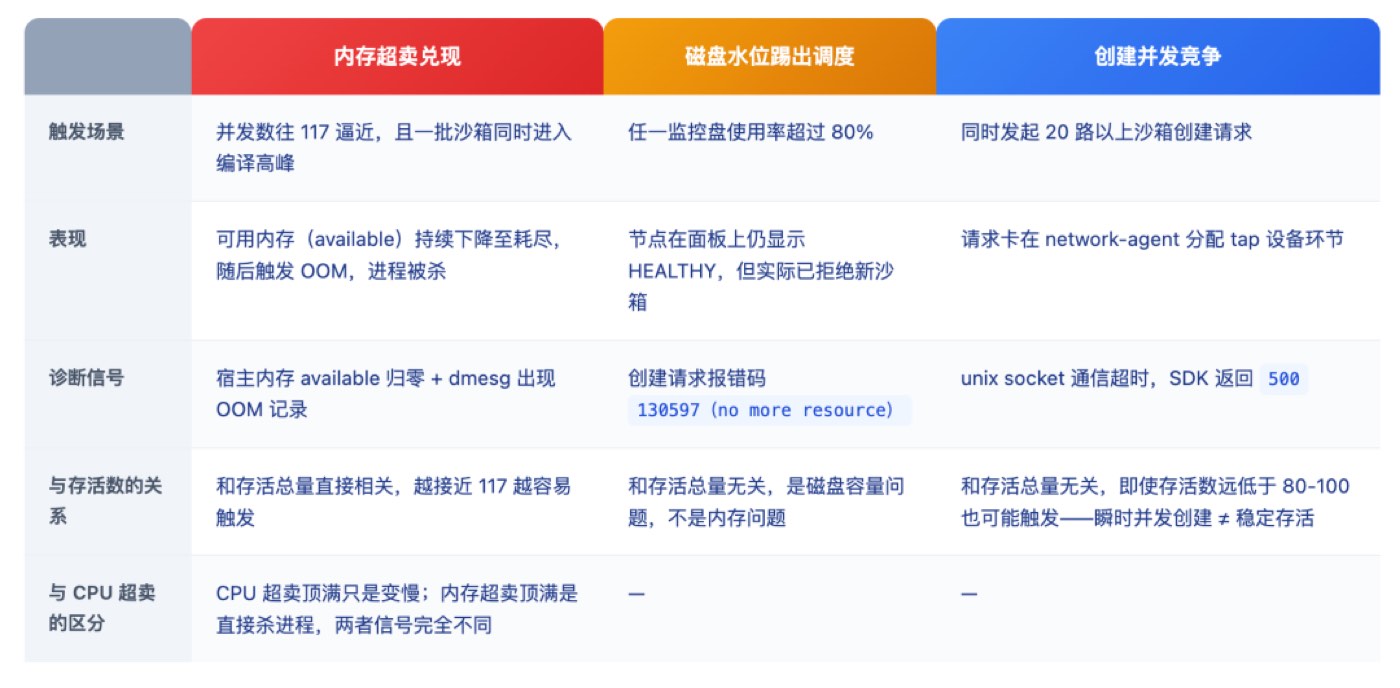
Table 1: Comparison table of the three bottlenecks
5. Evaluating the AutoPause Density Lever — and Choosing Conservatively
Beyond identifying the bottlenecks above, we also evaluated a lever that could further increase density: AutoPause. Its starting point: during Agent trajectory execution, most of the time is actually spent waiting for LLM inference results; the sandbox is idle during this wait, yet under the current scheduling model, idle sandboxes still occupy their full resource quota.
The AutoPause mechanism, available since Cube v0.5.0, snapshots a long-idle sandbox to disk, then shuts down the corresponding MicroVM to release physical resources, waking it in milliseconds when a new request arrives. The parameter controlling this mechanism's density effect is paused_resource_release_ratio in the Cubelet configuration, defaulting to 0.0. The default means: after a sandbox is paused, even though its physical CPU and memory have been returned to the host, the scheduler's books still count it as fully occupied — so density does not improve just by enabling AutoPause.
We evaluated raising this parameter to 0.7-0.8: with agent trajectories active roughly 20% of the time, paper density could theoretically rise 3-4×, equivalent to 350-470 sandboxes per node. But this improvement comes at a cost: after raising it, resume becomes best-effort — if the node is transiently short on resources, it directly returns a 409 error, meaning wake-up is no longer an operation with guaranteed success. We haven't yet built "automatic retry after resume failure" into a stable policy on the RL training side, so we haven't adjusted this parameter for now — paused_resource_release_ratio stays at its default 0.0. Fortunately, the parameter supports hot reload and can be adjusted without restarting the service; when training scale genuinely requires higher density later, we can re-evaluate.
6. Closing Thoughts
RL rollout scenarios differ from ordinary Agent services in three density requirements: trajectory lifecycles are minute-scale, so creation throughput matters more than steady-state residency; compile and test phases max out nominal memory, leaving limited oversell headroom; trajectories spend most of their time waiting for LLM returns, so density has theoretical room to grow — but it takes supporting fault tolerance to cash in.
The corresponding bottlenecks fall into three categories with distinct symptoms: when memory oversell is cashed in, available memory is exhausted and the host OOMs; when disk watermarks exceed thresholds, the node is removed from scheduling; during creation bursts, requests stall at network-agent's tap fd allocation. The three categories must be identified separately to locate the right adjustment direction.
Our practice follows three steps: first, derive the theoretical ceiling from sandbox specs and scheduling parameters to confirm which resource dimension the bottleneck lands on; then distinguish the meanings of the three numbers — safety boundary, paper ceiling, and measured steady state — clarifying whether each gap comes from oversell headroom or load peaks; finally, for every density feature, evaluate benefits against costs first, keep defaults until supporting fault tolerance is ready, and adjust once conditions are met.
Thanks to the Unisound Atlas Intelligent Computing Team for their contribution to this article.